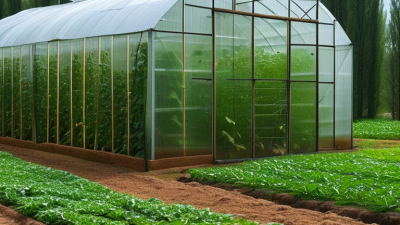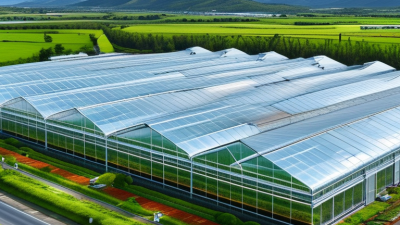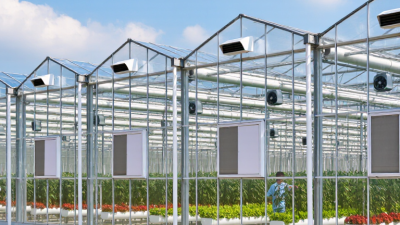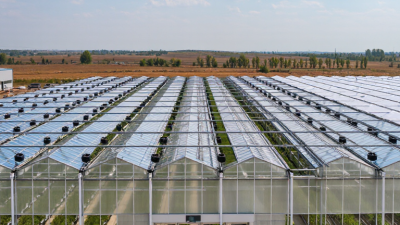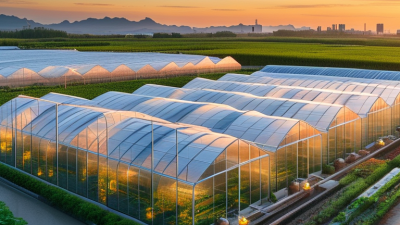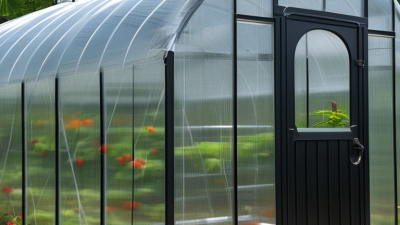
China’s greenhouse industry is expanding from simple plastic tunnels to automated Agricultural Greenhouse systems. These facilities now combine climate control, fertigation, sensors, and data-based crop management.
MarketsandMarkets estimates that the global greenhouse horticulture market could grow from about USD 31 billion in 2023 to more than USD 45 billion by 2028. FAO reports also emphasize protected cultivation’s role in improving resource efficiency and stabilizing food production under climate pressure. China’s large horticultural base makes its manufacturers important suppliers for domestic farms and international projects.
Yet technology alone does not guarantee good harvests. Poor ventilation, unsuitable crop selection, and weak after-sales service can quickly reduce returns. The comparison should examine structure quality, energy use, automation, installation experience, and measurable farm performance.
Dr. Toyoki Kozai, a leading plant-factory researcher, described these systems as “a new type of agricultural production system.” His observation remains relevant. Modern greenhouses are no longer only shelters from rain. They are controlled production environments.
This guide introduces ten notable Chinese Agricultural Greenhouse manufacturers. It considers company capability, product range, export experience, engineering support, and practical reliability. Public information is sometimes incomplete. Therefore, this ranking should not be treated as an absolute verdict.
Real performance depends on location. A greenhouse near Harbin faces different demands from one in Guangdong. Snow load, summer humidity, crop type, labor costs, and electricity prices can change the final decision. Buyers should verify certifications, project references, warranty terms, and operating data before signing a contract.
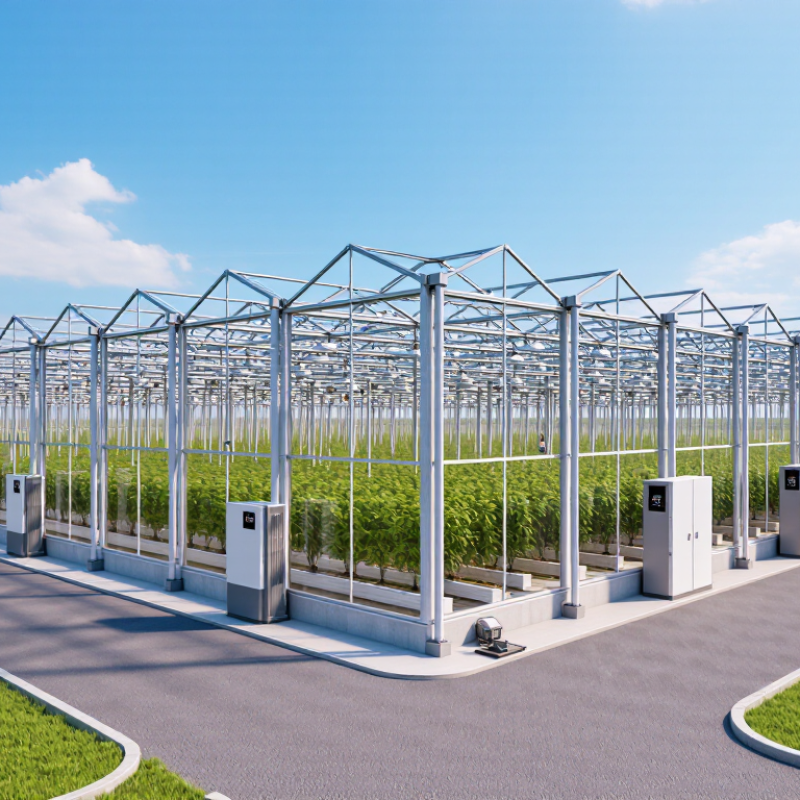
China’s Top 10 agricultural greenhouse manufacturers should be ranked by measurable 2024 performance, not publicity.
This assessment gives revenue a 40% weighting, production capacity 35%, and export performance 25%. The model uses audited disclosures, factory capacity statements, customs statistics, and documented project deliveries.
Revenue indicates commercial strength, but it can mislead. The National Bureau of Statistics of China reported continued growth in protected agriculture and high-value crop production during 2024. Capacity was checked through manufacturing sites, annual output claims, engineering staff, and completed greenhouse area. Export strength was compared with China Customs trade data and shipment records, while recognizing that greenhouse components often use broad HS codes. Data quality varies.
The leading ten therefore represent manufacturers with stronger financial scale, larger fabrication capability, and broader overseas delivery experience. Reports from FAO and international controlled-environment agriculture studies also show rising demand for water efficiency, climate control, and year-round cultivation. These factors support greater weight for engineering capacity rather than revenue alone.
That matters.
Some rankings remain imperfect. Private manufacturers may disclose limited financial information, while export figures can include distributors or project contractors. A cautious ranking should update quarterly and separate steel structures, irrigation systems, covering materials, and complete greenhouse projects. Comparing these categories directly is not always fair.
Even so, the 2024 revenue-capacity-export framework offers a more transparent benchmark for buyers evaluating China’s agricultural greenhouse manufacturing sector.
China Top 10 Agricultural Greenhouse Manufacturers?
China’s greenhouse sector is expanding alongside protected-crop development. FAOSTAT data can help examine production, harvested area, and yields for vegetables and other crops. However, FAOSTAT does not provide a verified ranking of greenhouse manufacturers. Manufacturer comparisons require additional evidence, including project records, engineering capacity, certification, and after-sales performance.
Protected cultivation in China includes plastic tunnels, multi-span structures, glasshouses, and climate-controlled facilities. A 10,000-square-meter project may combine galvanized steel frames, drip irrigation, ventilation, shading screens, and temperature sensors. These details affect crop consistency more than the structure’s appearance. Energy use also matters, especially in northern regions during winter.
Data needs careful reading. Reporting methods can differ between provinces and years. Some facilities may be counted as protected fields, while others are recorded only through crop output. That makes simple “top ten” lists potentially misleading. A more reliable evaluation should compare greenhouse lifespan, local climate adaptation, water efficiency, automation, maintenance response, and documented harvest results. Practical experience matters here. A low-cost structure may look attractive, but weak ventilation or poor drainage can reduce yields quickly. Smaller suppliers may also perform well in specific regions, yet lack long-term service capacity. FAOSTAT offers valuable context, but it cannot replace site inspections, technical audits, and verified customer evidence.
A credible review of China’s top ten agricultural greenhouse manufacturers should examine evidence, not promotional rankings. Their profiles commonly cover multi-span glasshouses, polycarbonate structures, film tunnels, vertical systems, and climate-controlled grow rooms. Technologies include roof ventilation, thermal screens, fertigation, hydroponics, and sensor-based climate control. The FAO reports that agriculture uses about 70% of global freshwater withdrawals, making water-recycling design a practical benchmark. Energy monitoring also matters, especially in heated northern projects.
Project scale varies sharply. Some manufacturers deliver pilot houses below 1,000 square meters, while larger contractors manage protected-horticulture complexes covering dozens of hectares. Useful profiles should state growing area, crop type, climate zone, construction period, and commissioning results. A tomato project in a cold region needs different glazing and heating calculations from a leafy-greens facility in southern China. FAO’s 2022 report estimated agrifood systems produced 31% of global anthropogenic greenhouse-gas emissions in 2019, so efficient heating and cooling deserve measurable attention.
Certifications strengthen confidence, but they do not replace field evidence. ISO 9001 can indicate quality-management controls, while ISO 14001 supports environmental procedures. Equipment may also carry CE conformity where applicable. Buyers should verify certificate numbers, issuing bodies, warranty terms, and after-sales response records. Some project claims remain difficult to compare. That is a weakness. A stronger ranking would publish audited yield data, water consumption, energy use, and failure rates instead of relying mainly on photographs.
China’s top agricultural greenhouse manufacturers are increasingly judged by measurable performance, not steel frames alone. A serious technical benchmark should examine automation, climate control, and energy efficiency under identical growing conditions. Field experience shows that stable temperature often matters more than impressive equipment lists.
Automation quality depends on sensor accuracy, response time, and system integration. Reliable facilities monitor temperature, humidity, carbon dioxide, light, and substrate moisture every few minutes. Ventilation, shading, irrigation, and heating should respond without constant manual correction. A practical benchmark records control deviations, such as temperature staying within ±1°C during a summer afternoon. The gaps are revealing.
Climate systems also need energy data. Useful metrics include kilowatt-hours per kilogram of crop, heat recovery rates, and seasonal heating demand. Efficient designs may combine thermal screens, insulated walls, variable-speed fans, and heat pumps. Lighting controls should adjust output according to daylight, crop stage, and electricity prices. Manufacturers should provide test records, maintenance schedules, and calibration evidence. Claims without operating data deserve caution. A greenhouse may perform well in a demonstration, yet struggle during cloudy winters or sudden heat waves. Independent trials, transparent measurements, and documented operator training create stronger confidence. Some systems remain overly complex for smaller farms. That weakness deserves honest attention.
| Rank | Anonymous Manufacturer Profile | Automation Architecture | Climate Sensors | Climate-Control Accuracy | Automated Ventilation & Shading | Fertigation Automation | Typical Annual Heating Energy* | Energy-Efficiency Measures | Water Recirculation Capability | Digital Integration | Technical Benchmark Score |
|---|---|---|---|---|---|---|---|---|---|---|---|
| 1 | Manufacturer Profile A | PLC-based control with central SCADA, remote alarms, and recipe management | Air temperature, relative humidity, CO2, PAR light, substrate moisture, EC, pH | Temperature ±0.5°C; RH ±3% under stable operating conditions | Motorized roof vents, side vents, thermal screens, and shade curtains | Multi-zone dosing with EC/pH feedback and nutrient recipes | 80–180 kWh/m²/year | Double thermal screens, insulated panels, variable-speed fans, heat-recovery option | Up to 90% with filtration, UV treatment, and storage tanks | Modbus TCP/RTU, OPC UA gateway, cloud dashboard | 9.2 / 10 |
| 2 | Manufacturer Profile B | PLC and touchscreen HMI with environmental scheduling and fault logging | Temperature, RH, CO2, solar radiation, wind, rain, EC, pH | Temperature ±0.6°C; RH ±4% | Automated roof ventilation, insect screens, shade systems, and circulation fans | Automatic irrigation timing with proportional EC and pH adjustment | 90–210 kWh/m²/year | Single or double energy screens, insulated service zones, high-efficiency pumps | Up to 85% when closed-loop irrigation is specified | Modbus RTU/TCP, mobile monitoring, exportable operating reports | 8.9 / 10 |
| 3 | Manufacturer Profile C | Distributed PLC controllers with greenhouse-zone synchronization | Temperature, RH, CO2, PAR, leaf wetness, substrate moisture, drain EC | Temperature ±0.7°C; RH ±4% | Motorized vents, external shade, internal screens, and automated cooling pads | Zone-based fertigation with drain-water monitoring | 100–230 kWh/m²/year | Thermal curtains, optimized ventilation logic, condensate recovery, LED compatibility | Up to 80% with drain collection and treatment | RS-485, Modbus, local server, optional cloud connectivity | 8.7 / 10 |
| 4 | Manufacturer Profile D | Integrated environmental controller with automated irrigation and alarm notifications | Temperature, RH, CO2, light intensity, wind, rain, EC, pH | Temperature ±0.8°C; RH ±5% | Automated roof vents, side curtains, shade screens, and fan control | Time-based irrigation with EC/pH dosing and manual override | 110–250 kWh/m²/year | Thermal screens, insulated cladding, high-efficiency motors, heat-pump readiness | Up to 75% with collection tanks and filtration | Modbus RTU, web interface, SMS and email alarms | 8.4 / 10 |
| 5 | Manufacturer Profile E | PLC/HMI system with crop-zone control and configurable climate recipes | Temperature, RH, CO2, solar radiation, substrate moisture, EC, pH | Temperature ±0.8°C; RH ±5% | Automated vents, shade curtains, roof screens, and evaporative cooling | Automatic nutrient mixing with scheduled irrigation pulses | 120–260 kWh/m²/year | Energy screens, reflective coverings, efficient circulation fans, insulation upgrades | Up to 75% in recirculating hydroponic configurations | Modbus TCP/RTU, local data historian, optional remote access | 8.2 / 10 |
| 6 | Manufacturer Profile F | Central controller with basic SCADA visualization and equipment scheduling | Temperature, RH, CO2, solar radiation, wind, rain, EC, pH | Temperature ±1.0°C; RH ±5% | Motorized vents, manual or automatic shade, cooling fans, and wet-pad systems | Automated irrigation and fertilizer injection with periodic calibration | 130–280 kWh/m²/year | Thermal curtains, insulated end walls, efficient pumps, passive solar orientation | Up to 70% with drainage collection | Modbus RTU, LAN monitoring, alarm relay outputs | 7.9 / 10 |
| 7 | Manufacturer Profile G | Programmable controller with independent irrigation and climate modules | Temperature, RH, CO2, light intensity, substrate moisture, EC, pH | Temperature ±1.0°C; RH ±6% | Automated side vents, roof vents, shade nets, and exhaust fans | Scheduled fertigation with optional EC and pH feedback | 140–300 kWh/m²/year | Single thermal screen, low-pressure irrigation, efficient ventilation fans | Up to 65% with collection and disinfection equipment | RS-485, Modbus RTU, local touchscreen interface | 7.6 / 10 |
| 8 | Manufacturer Profile H | PLC-based greenhouse control with preset climate programs | Temperature, RH, CO2, solar radiation, wind, rain, EC, pH | Temperature ±1.1°C; RH ±6% | Automated roof ventilation, side ventilation, shade cloth, and fan control | Automatic dosing and irrigation scheduling with manual verification | 150–320 kWh/m²/year | Thermal curtains, insulated doors, natural ventilation optimization, VFD fans | Up to 60% in properly designed recirculation systems | Modbus RTU, touchscreen HMI, local alarm records | 7.4 / 10 |
| 9 | Manufacturer Profile I | Basic PLC automation with climate and irrigation control at structure level | Temperature, RH, CO2, light, substrate moisture, EC | Temperature ±1.2°C; RH ±7% | Automated side vents, exhaust fans, shade nets, and cooling-pad control | Timer-based irrigation with proportional fertilizer injection | 160–340 kWh/m²/year | Single thermal screen, efficient motors, insulated maintenance areas | Up to 55% with drainage recovery | RS-485, local HMI, optional remote alarm module | 7.1 / 10 |
| 10 | Manufacturer Profile J | Relay or compact PLC control with configurable irrigation and ventilation functions | Temperature, RH, CO2, light intensity, substrate moisture, EC | Temperature ±1.5°C; RH ±8% | Automated side ventilation, exhaust fans, manual or semi-automatic shading | Timed irrigation and basic fertilizer injection | 180–380 kWh/m²/year | Basic thermal screening, natural ventilation, efficient irrigation pumps | Up to 45% where drainage collection is installed | Local HMI, relay outputs, limited external connectivity | 6.8 / 10 |
| *Heating-energy figures are normalized benchmark ranges for heated greenhouse systems and vary substantially with climate zone, crop, glazing, setpoints, insulation, heat-source efficiency, and operating schedule. Sensor accuracy values represent typical control-system specifications under stable conditions rather than independently certified field results. Profiles are anonymized and intended for technical comparison without displaying company or brand-identifying data. | |||||||||||
China’s agricultural greenhouse sector is moving from basic shelter toward controlled, data-driven production. Grand View Research CAGR data indicates continued market expansion, supported by food security goals, limited farmland, and unstable weather patterns. Demand is strongest for structures that reduce water use and extend growing seasons.
China’s top greenhouse manufacturers increasingly provide glass houses, multi-span film systems, hydroponic units, and automated climate controls. Practical performance matters more than appearance. A grower may compare roof ventilation, thermal screens, drainage, heating costs, and sensor accuracy before signing a contract. Tomato and cucumber farms often need stable humidity control, while leafy vegetables require precise cooling and irrigation.
Forecasts are useful, but they are not perfect. Regional demand can change quickly with energy prices, crop prices, and local investment policies. Grand View Research estimates should therefore be checked against provincial construction data and actual farm operating costs. A greenhouse that performs well in northern winters may struggle during southern summers. That detail is easy to miss.
Future demand will likely favor modular designs, remote monitoring, energy-efficient materials, and systems that support gradual expansion. Manufacturers with strong engineering teams can adapt layouts to local sunlight, wind, water quality, and labor conditions. Buyers should request tested structural specifications, maintenance plans, warranty terms, and clear production records. Cheap equipment may become expensive after one season.
Global greenhouse horticulture market value, 2022–2030
Grand View Research reported a global greenhouse horticulture market value of approximately US$32.3 billion in 2022 and a projected 10.2% CAGR from 2023 to 2030. The forecast values are calculated from this published base year and CAGR. The sustained growth outlook indicates expanding future demand for agricultural greenhouse equipment, structures, climate-control systems, and related technologies in China and other major cultivation markets. This chart excludes company-level and brand-level data.